
By and large, dollar cost averaging places great emphasis on using a disciplined approach towards investing. In detail, we will invest our budget regardless of the portfolio’s price on each time period. In time to come, we will accumulate enough investment units that may turn into a profit. With this in mind, let’s understand the concept and find out whether this strategy works that well.
Table of Contents:
- Guiding Principles for Dollar Cost Averaging
- Understanding the Concept
- When the Price moves Downwards
- When the Price moves Upwards
- When the Price moves Down, then Upwards
- When the Price moves Up, then Downwards
- What is Dollar Cost Averaging good for?
- Real Life Application
One Minute Summary:
- Overall, dollar cost averaging ignores the price fluctuation and market trend in investment.
- Instead, it focuses on investing the same budget on every pre-defined time period.
- Above all, dollar cost averaging works only if the portfolio’s price recovers eventually.
Part 1: Guiding Principles for Dollar Cost Averaging
Altogether, there are three guiding principles:
- Firstly, there is a defined period on which the investment is made, e.g. 10 periods;
- Next, we will invest the same capital during each time period, e.g. $1,000 per period;
- Finally, we will invest on each time period, i.e. no period is skipped or missed.
For that reason, we will invest the same amount of capital on every time period. Emphatically, we will ignore any price fluctuation in the portfolio throughout our investment period.
Part 2: Understanding the Concept
Part 2.1: Basic Assumptions
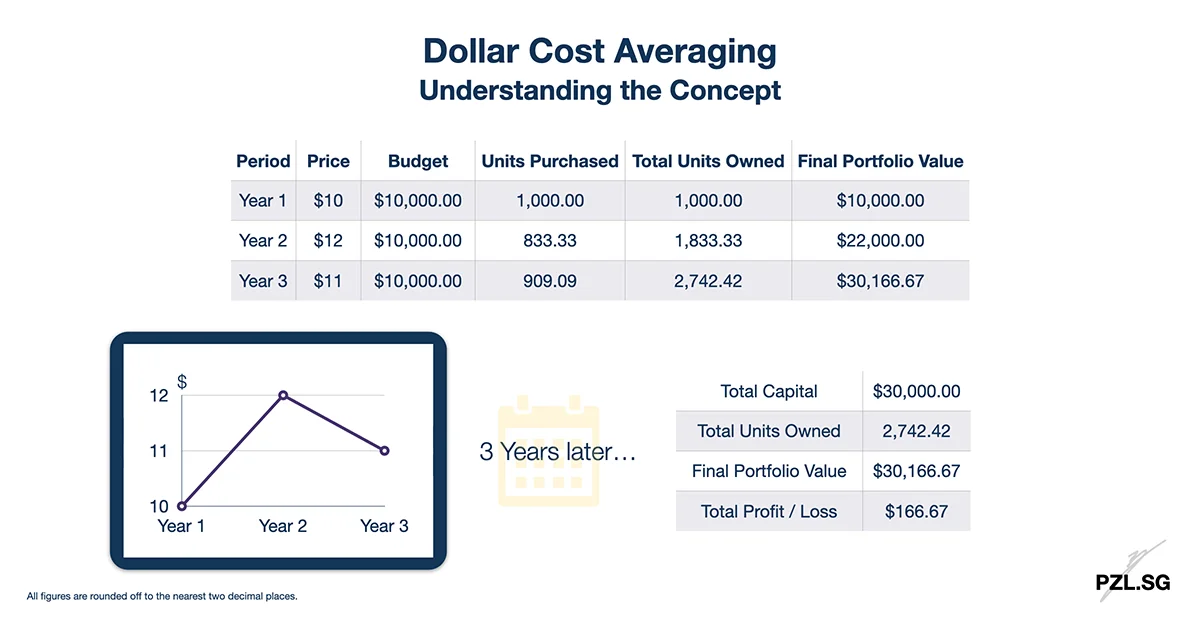
As as start, let’s understand how dollar cost averaging works as an investment strategy. To illustrate, we will use the following assumptions:
- Number of Periods: 3 years
- Capital for each Period: $10,000
- We will invest the same capital ($10,000) for each period (year 1 to year 3).
- All figures are rounded off to the nearest 2 decimal places.
To begin with our investment journey, let’s invest our budget of $10,000 into a portfolio. Seeing that current market price at $10 per investment unit, we will own 1,000 investment units today.
Part 2.2: When the Price moves Upwards
During the second year, the portfolio’s price increased to $12. In view of our budget of $10,000, we will purchase an additional $10,000 / $12 = 833.33 investment units.
In contrast, we bought lesser investment units than year 1. This is owing to the higher price per investment unit now.
Part 2.3: When the Price moves Downwards
In the third year, the portfolio’s price fell to $11. As a result, our budget allows us to buy $10,000 / $11 = 909.09 investment units.
By comparison to the second year, we are able to purchase more investment units. This is given that lower price per investment unit.
In summary, we stick to the same budget and purchase the maximum investment units each time.
- When the price is high, we will buy lesser investment units.
- On the other hand when the price is low, we can afford to buy more investment units.
Now that you have a grasp on dollar cost averaging, let’s go through four examples together.
Part 3: When the Price moves Downwards
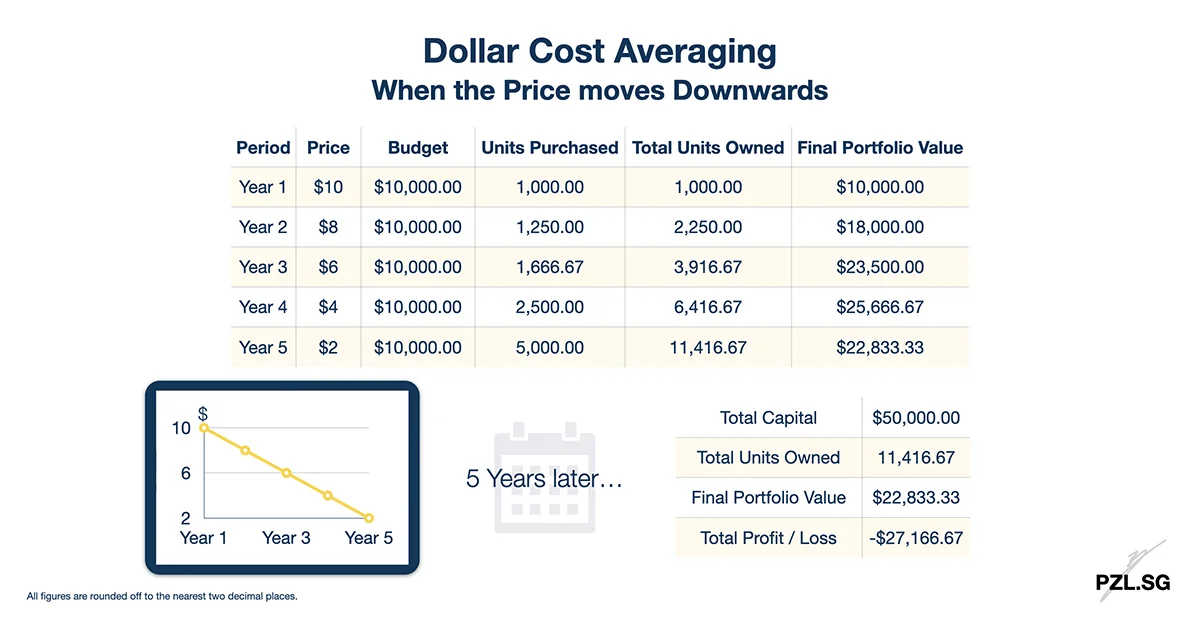
To illustrate, let’s start with an annual budget of $10,000. On this occasion, we will purchase $10,000 / $10 = 1,000 investment units.
Part 3.1: At Year 2, Price per Investment Unit = $8
Since the price of an investment unit is cheaper, we are able to buy more units. Consequently, we will purchase another $10,000 / $8 = 2,250 investment units.
In essence, we will use our budget and repeat this process every year.
Part 3.2: Five years later…
Eventually, we invested a total capital of $50,000 with 11,416.67 investment units. At the present time, these investment units are worth 11,416.67 x $2 = $22,833.33. In other words, we lost $50,000 – $22,833.33 = $27,166.67.
Part 3.3: Long-Term Outlook
In the long run, dollar cost averaging allows us to purchase more investment units in the downtrend market. However, this strategy ignores the portfolio’s fundamentals and market movement. Under those circumstances, we may empty our life savings into a bottomless pit. Hence, dollar cost averaging does not work this time.
Part 4: When the Price moves Upwards
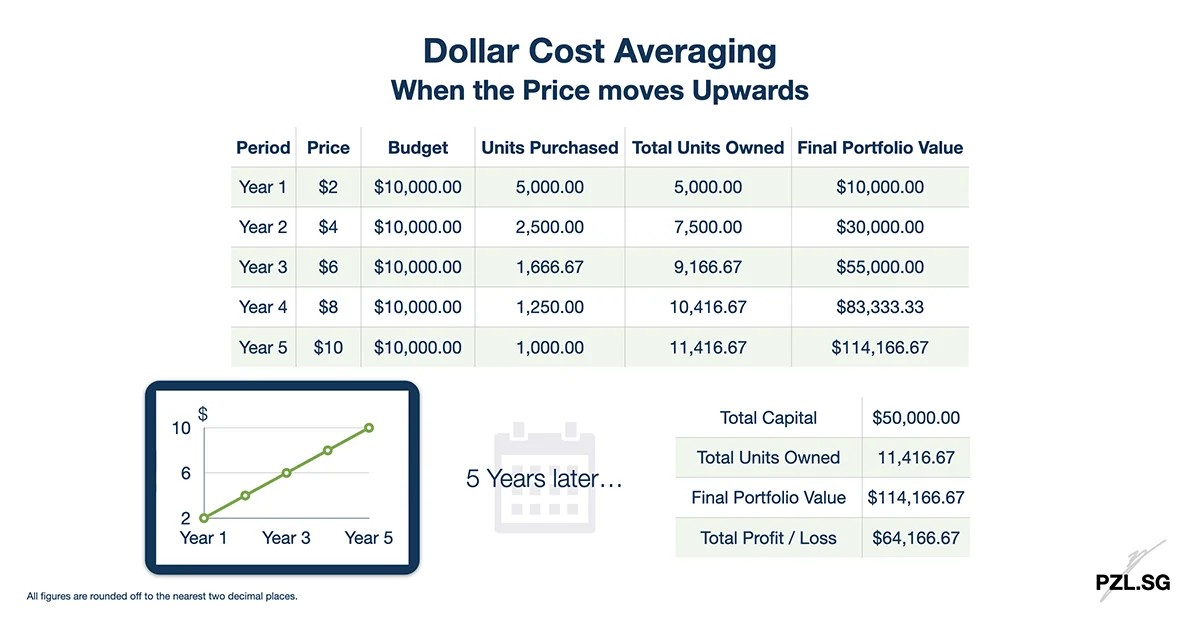
Comparatively, let’s look at an example when the portfolio portrays an upward trend. In the same way, we invest a capital of $10,000 each year. In this case, we will purchase $10,000 / $2 = 5,000 investment units.
Part 4.1: At Year 2, Price per Investment Unit = $4
Given that higher price, we will buy $10,000 / $4 = 2,500 investment units only.
Summing up, we will use up our budget to repeat this process every year.
Part 4.2: Five Years later…
Be that as it may, we ended the fifth year with 11,416.67 investment units. At this point, these investment units are worth 11,416.67 x $10 = $114,166.67.
To sum up, our total profit is $114,166.67 – $50,000 = $64,166.67.
Part 4.3: Long-Term Outlook
Given that higher volume of investment units at the start, our profit increases as the market continues to rise. As a matter of fact, this should be an obvious phenomenon during a bull run.
Part 5: When the Price moves Down, then Upwards
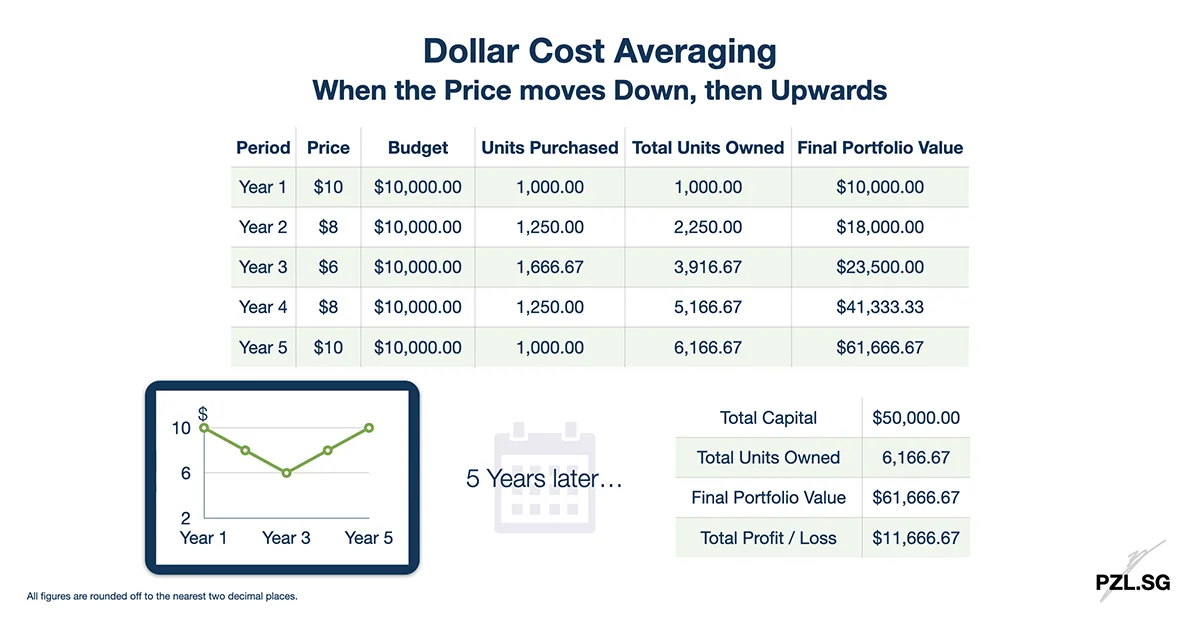
After two simple rounds of investing, let’s combine the scenarios from Part 3 and Part 4 together. Correspondingly, we will use the same budget of $10,000 per year. On this occasion, we can purchase $10,000 / $10 = 1,000 investment units.
Thereafter, we will repeat the process from Part 3 or Part 4. In short, we will ignore the unit price and exhaust our budget ever year.
Part 5.1: Five Years later…
In time to come, we have 6,166.67 investment units in the fifth year. At this time, they are worth 6,166.67 x $10 = $61,666.67.
Summing up, this gives us a profit of $61,666.67 – $50,000 = $11,666.67.
Part 5.2: Long-Term Outlook
Owing to the initial downtrend, we managed to buy more investment units. After the portfolio’s recovery, these investment units are worth a higher value. Despite staying at the same unit price (as year 1), dollar cost averaging helps us to reap a 23% profit!
Part 6: When the Price moves Up, then Downwards
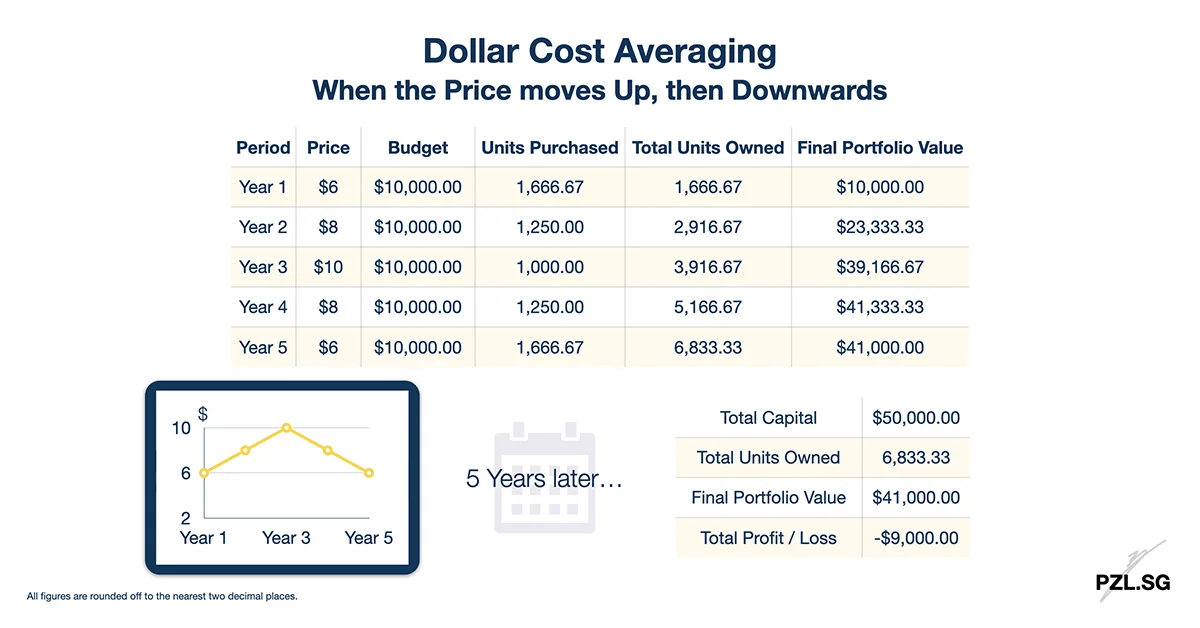
In contrast, let’s invert the scenario in part 5. In like fashion, we will keep our annual budget of $10,000. Accordingly, we will purchase $10,000 / $6 = 1,666.67 investment units.
Thereafter, we will repeat the process from Part 3 or Part 4. In the same way, we will ignore the unit price and exhaust our budget ever year.
Part 6.1: Five Years later…
At length, we have 6,833.33 investment units in the fifth year. Presently, these investment units are worth 6,833.33 x $6 = $41,000.
In sum, we lost $50,000 – $41,000 = $9,000.
Part 6.2: Long-Term Outlook
Unlike the situation in Part 5, we lost 18% of our capital. For one thing, this proves that dollar cost averaging works only if the portfolio recovers in time. Otherwise, there is a high chance of losing more money in the future.
Part 7: What is Dollar Cost Averaging good for?
In the final analysis, dollar cost averaging creates simplicity in investing by ignoring the market trend. Since this is not a foolproof strategy, you may consider it when you
- Have a limited investing capital;
- Prefer not to invest all of your capital at one go;
- Are unsure of the market direction.
Above all, every investment comes with some form of investment risks. With this in mind, you should invest based on your risk appetite after a thorough research. At the end of the day, you won’t want to lose your life savings.
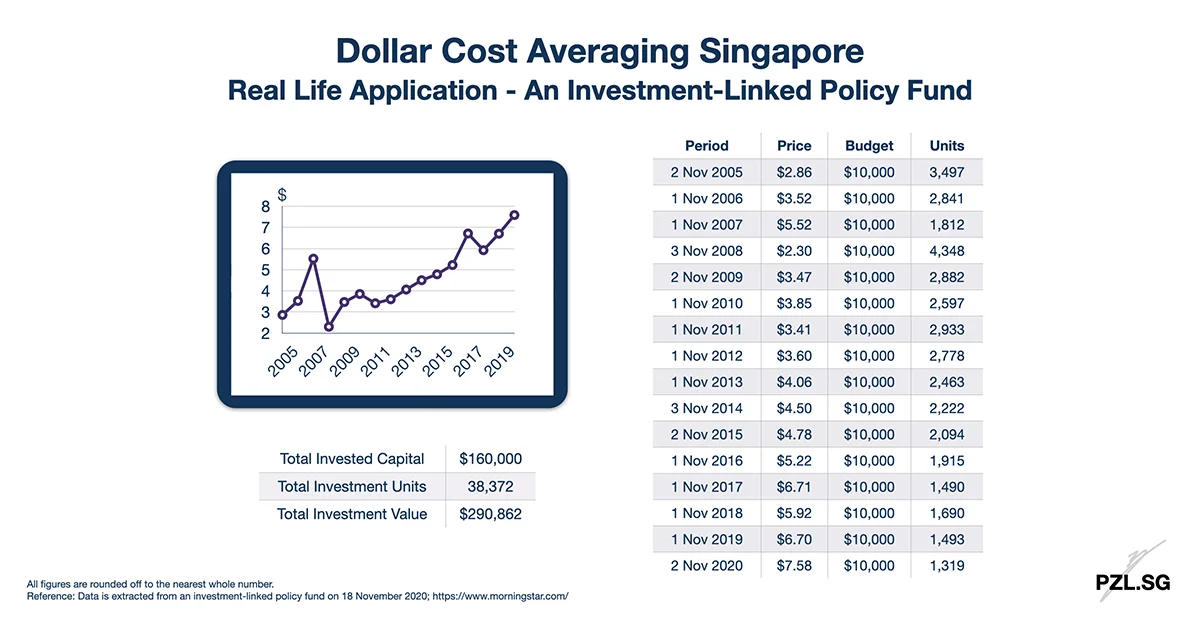
Part 8: Real Life Application
Before I end, here is a real life application for dollar cost averaging. For this purpose, I took the data from an investment-linked policy fund.
First Published: 27 November 2019
Last Updated: 19 November 2020


Leave a Reply